
Moodyanalytics
Apartment sets new record, Office continued its bumpy ride, and Retail stayed flat
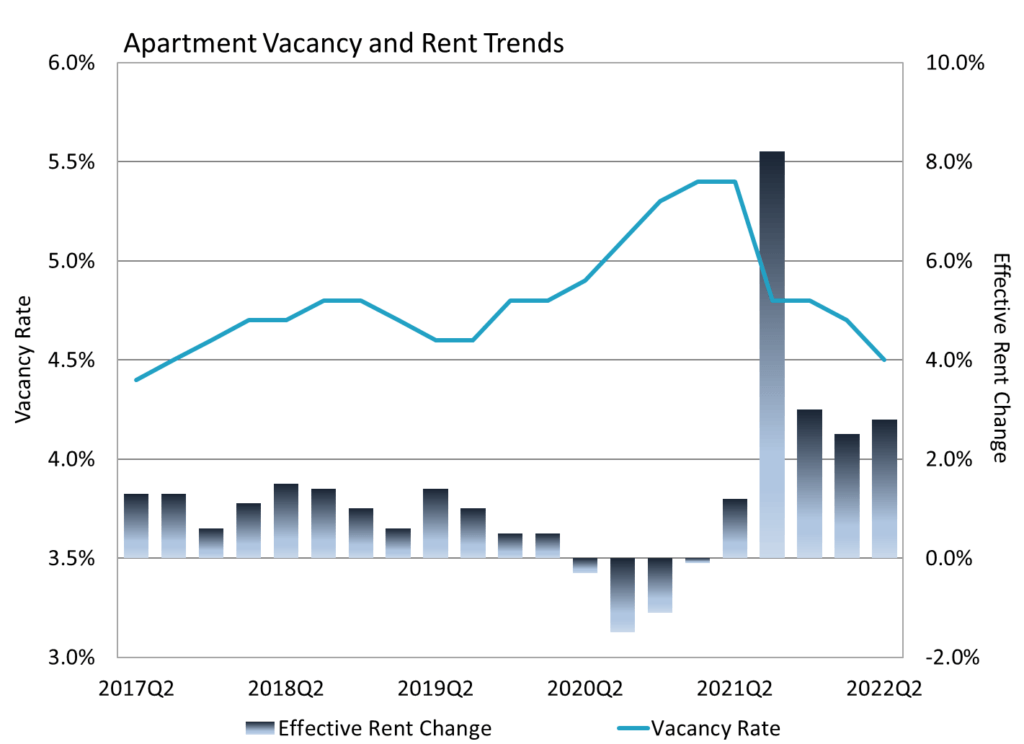
We started the 2nd quarter of the year with lowered COVID restrictions but persistent price increases and hawkish Federal Reserve monetary policies, all while under the backdrop of many geopolitical and economic uncertainties. Despite these challenges, the multifamily market posted another quarter of record growth. Vacancy decline accelerated from the 1st quarter and was down another 20 basis-point (bps) to a five-year low at 4.5%. On a year-over-year basis, vacancy dropped by a cumulative 90 bps, the steepest annual decline over the past two decades. While new construction continued to be sluggish, demand has remained strong with a net absorption rate hovering above 30,000 units. Even though affordability has eroded due to the rapid increase of average rent and only modest growth in median household income across the United States, multifamily demand was supported by strong Gen Z household formation, and would-be first-time home buyers who have been priced out of the entry level housing market due to a 21% overvaluation of single-family home price in general, and a 17.2% price appreciation in the most affordable [1] This steady multifamily demand and tight supply translated into 2.7% and 2.8% increase in asking and effective rent on a quarter-over-quarter basis, which puts the year-to-date asking/effective rent growth to 5.2% and 5.4% respectively. Factoring in the rapid recovery back in Q3 2021, and asking and effective rent have grown 16.7% and 17.5% over the past 12 months, setting a new year-over-year record in our more than 20 years of tracking national level trends.
Figure 1:
Office sector performance, however, continues to be bumpy. Coming off a strong sector rebound in Q3 2021, net absorption continued to dwindle and entered negative territory to close the 2nd quarter at -8.4 million sqft nationally. Although, the month-over-month dynamics showed most of the negatives were accumulated in April and that demand has been rebounding since. Total net absorption has actually turned positive in June and nearly 50 out of our 79 tier-1 metros have more move-ins than move-outs from the latest monthly reading. The subtle demand upshift was consistent with changes in the return-to-office sentiment. Even though this does not mean all employees will be working from the office 40 hours a week, a consensus is growing that some office presence is valued, especially for workers without much experience. Inflation pressure have also started to weigh in longer-term decision making for both tenants, as well as developers. Construction largely stayed at the same level as last quarter with a modest 5.8 million sqft delivered in Q2. This result is of little surprise as physical office occupancy has been mired in the 40% range since April, according to Kastle Back-to-Work Barometer report [2], compared to around 65% pre-pandemic.
Given the intriguing supply and demand dynamics, office vacancy trended up 30 bps and finished the2nd quarter at 18.4%, merely 10 bps lower than its pandemic high in Q2 2021. On the rent front, both asking and effective rents edged up 0.4% during the quarter – these are the highest growth rates since the pandemic began. In a recent study[3], we compared the space/capital market data and pointed out how the current downturn for offices looks ‘historically benign’. In comparison to the two earlier downturns of this century, office using firms have remained profitable, and even though remote work is taking hold, firms have yet to shed space in a way that dramatically moves the needle. Looking forward, an economic slowdown will some place negative pressures on the sector, but longer-term sentiment for the office-using, knowledge based US economy is still strong. All things considered, we will likely experience some turbulence in the office market performance, and the metro level differences will be interesting to watch. In particular, geographic locations with growing tech sector employment have been faring better than the rest of the nation since the pandemic [4] and they may help provide some level of long-term stability and resilience for the overall sector performance.
Figure 2:

On the retail front, the latest Census data shows that total retail sales were up 8.1% on a year-over-year basis, but retail and food service spending without CPI adjustment posted a 0.3% decline in May.
Consumers started to pull back on spending as inflation soared but spending is still generally high, and the desire for in-person shopping and dining continues to perform admirably. E-commerce retail sales as a percentage of total retail sales trended down from its peak of 16.4% at the onset of the pandemic to 14.3% in the 1st quarter of 2022. The continued oscillation of this rate, in addition to upticks in brick-and-mortar foot traffic reaffirms the importance of omnichannel retail in comparison to just online. Overall, pent-up demand versus heightened inflation pressure played an interesting push and pull on the retail sector’s performance. Our data shows the national vacancy for neighborhood and community shopping center has stayed flat at 10.3%, while asking rent is virtually unchanged and effective rent inched up 0.1% in the second quarter. Trend data on regional and super regional malls tells a similar story. Vacancy stayed flat at 11% and effective rent was up 0.1% this quarter. Despite some signs of stabilization, our commercial mortgage delinquency data shows regional mall properties continue to be the most at-risk retail subtype and they are driving overall delinquency behavior among retail assets[5]. Sector wise, declining retail sales and consumer confidence remains the headwind for the sector’s performance in the short term, but ongoing sector evolution should begin to form a new equilibrium in the longer run.
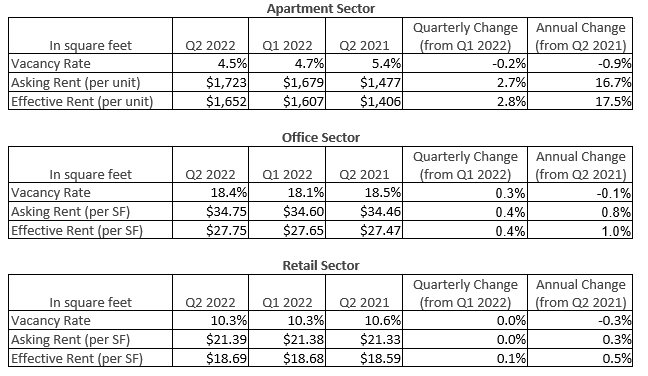
Table 1: Summary of Moody’s Analytics REIS Q2 2022 Statistics
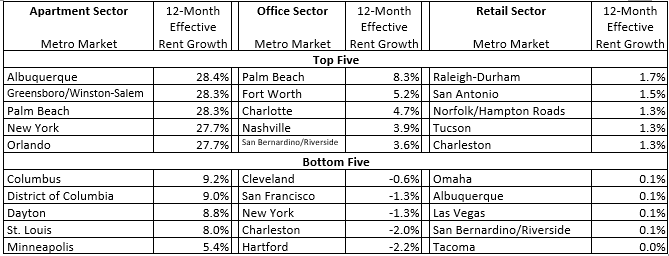
Detailed analysis of metro-level data paints a much more nuanced picture for multifamily sector: In the 2nd quarter, only 5 metros posed vacancy increase: Buffalo (+0.5%), Chattanooga (+0.4%), Syracuse (+0.3%), Columbia (+0.3%), and Greensboro/Winston-Salem (+0.2%). Among the other 74 tier-1 metros, 15 had vacancy level unchanged, and 59 cities saw 10 to 140 bps vacancy decline, with Fairfield County (-1.4%), Miami (-1.1%), and San Jose (-0.7%) doing the best. On a trailing 12-months basis, the list of metros experienced vacancy increase has shortened to just 2 – Buffalo (+1.0%) and Dayton (+0.3%), while Raleigh-Durham (-2.3%) and Charleston (-2.1%) improved the most. On the rent front, Greenville (effective: +6.5%, asking: +6.5%), Lexington (effective: +6.1%, asking: +5.9%), and Charleston (effective: +6.0%, asking: +5.8%) were leading the growth. Only 7 metros had declining asking/effective rent in Q2 and Tulsa (effective: -2.6%, asking: -2.3%), San Francisco (effective: -1.7%, asking: -1.6%), and Little Rock (effective: -1.3%, asking: -1.1%) lost the most. In a rolling 12-month window, all top-79 metros have exceeded their asking/effective rent level from a year ago, ranging from 5.2%-27.9% growth for asking and 5.4%-28.4% growth for effective rent. Albuquerque (effective: +28.4%, asking: 27.4%), Greensboro/Winston-Salem (effective: 28.3%, asking: 27.9%), and Palm Beach (effective: 28.3%, asking: 27.9%) topped the rent growth list on a year-over-year basis.
For office sector, New York (11.0%), Long Island (13.2%) and Little Rock (13.4%) were the top 3 metros with the lowest office vacancy. Both Boston (13.6%) and San Francisco (13.8%) fell out of the top 3 position due to a vacancy increase of 0.8% and 0.5% respectively. In this quarter, 43 out of 79 metros have seen their vacancy rate either decline or unchanged. Among these metros, Indianapolis (-2.1%), Nashville (-1.9%), and Knoxville (-1.5%) had greater than a 1 percentage point vacancy decline. On the other end of the spectrum, Columbia (+3.2%) and Houston (+3.1%) added more than 3percentage points to their respective vacancy rates. Among all 79 tier-1 metros in the US, rent level either increased or remain unchanged from the previous quarter for 61 metros, 6 more than the last quarter. Fifteen of these 61 metros recorded more than 1% gain. Seattle (+2.0%) and Indianapolis (+1.7%) were the top performers on the effective rent front. There were 18 metros that suffered decline in effective rent, with Hartford (-1.2%) and Houston (-0.9%) feeling the most pain. Examining the year-over-year performance, Charleston (vacancy: +4.6%; effective rent: -2.0%) and Hartford (vacancy: +3.9%; effective rent: -2.2%) ranked the bottom with the highest vacancy increase and steepest effective rent decline. Given the interesting demand dynamics we saw in the trend data, we ranked order all tier-1 metros by their quarterly net absorptions.
Finally, retail performance had improved for most metros in the quarter. Fifty-nine out of 77* metros had seen either their vacancy rate decline or unchanged, which was 4 more than the last quarter. San Francisco (4.9%), Seattle (5.4%), and San Jose (5.6%) led the nation with vacancy rates below 6%. In particular, Seattle made its way up on the list due to a 60-bps drop in vacancy. Only two other metros – Tacoma (-1.0%) and St. Louis (-1.0%) – had more improvement in vacancy in the second quarter. On the rent front, Greensboro (+0.7%), San Antonio (+0.6%), Columbus (+0.5%), and Raleigh-Durham (+0.5%) all recorded more than 50 bps growth in effective rent, but the list of metros experiencing effective rent decline now grew from 7 to 11. Assessing the 12-month overall retail sector performance, zero metro had experienced drop in effective rent, and Raleigh-Durham (+1.7%) and San Antonio (+1.5%) have had the most gain compared to a year ago.
*These retail statistics represent neighborhood and community shopping centers only. Moody’s Analytics CRE does not report mall rents at the metro level.
Table 2: Annual Effective Rent Growth: Top Five and Bottom Five Metros
As we gradually put the pandemic behind us, a continuation of more chronic CRE and economic issues, as well as some emerging concerns will prompt uncertainty for the market. Higher energy and commodity price continue to affect every aspect of our life and aggressive monetary policy will slow the economy, which may impact the ability for future rent increases within particular sectors of commercial real estate. Real GDP decreased at an annual rate of 1.6% in the first quarter of 2022, according to the “third” estimate released by the Bureau of Economic Analysis on June 29[6], which was a sharp turnaround from the real GDP growth of 6.9% the quarter before that. Even the increasing odds of recession did not stop mortgage rates from rapidly rising from 3.1% at the beginning of December to 5.2% in mid-June. While problematic for the single family market, multifamily real estate should continue to grow as higher borrowing cost and elevated housing prices keep prospective buyers in their apartments longer. It is worth noting that even though almost all subtypes would be affected during an economic downturn, multifamily performance may differ between city center versus suburb, or class A properties versus B/C properties. As for office and retail, compared with multifamily sector, there are more uncertainties, or noise, surrounding these markets’ future performances. Both sectors are going through their own evolutions and a bumpy ride is likely as they progress towards their new equilibriums.