
NMHC
More than half of all U.S. apartment households were cost burdened in 2020—paying more than 30% of their income on rent. However, many of these households had different financial conditions driving their burden status.
This edition of Research Notes uses NMHC tabulations of 2020 American Community Survey microdata to examine different types of burdened renters. We highlight three below. By breaking down the disparate housing affordability circumstances faced by each type of burdened renter, we demonstrate how a one-size-fits-all policy solution approach is insufficient to solve the affordability problem.
- Low Earners (23% of all burdened apartment households):
These are apartment households that are cost burdened because they have so little income. Members of this group will likely never be able to afford market-rate housing without some form of financial assistance or government subsidy, no matter how inexpensive.
- Geographically-Burdened Households (15% of all burdened apartment households):
Members of this group earn a moderate income, but because they live in more expensive markets where there is a notable supply-demand mismatch, they are housing cost burdened. If they were able to live in more inexpensive housing markets or, alternatively, if more units were built in their existing housing markets, alleviating pricing pressures, it’s likely many would not be burdened.
- High Earners (4% of all burdened apartment households):
These are very high-income apartment households who choose to pay more than 30% of their income on rent, even though more affordable housing options are available to them. Despite appearing cost burdened, these households typically are not in need of any form of assistance; they could simply choose to live in a cheaper apartment.
Together, the renters that fall within our precise definitions outlined above encompass 43% of all cost-burdened apartment households and describe distinct types of renters, each with a unique set of affordability needs. Those remaining unclassified burdened households may fall outside of the scope of our findings but still likely fall somewhere on the cost-burdened spectrum, sharing characteristics with one or more of the categories we defined.
This classification system demonstrates the varied nature of apartment households and the danger of a one-size-fits-all approach to analyzing and solving the housing affordability crisis. Such an approach focuses too narrowly on the total number of households facing burdens while oversimplifying the magnitude of the deep burdens that some select low-income households face.
Low-Earner Renters Can’t Find Affordability Anywhere
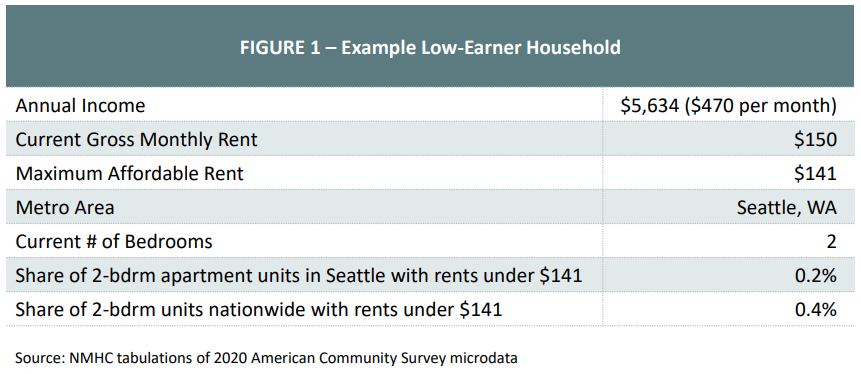
We identify a low earner as a cost-burdened apartment household that could afford, based on reported income, no more than 5% of the apartment units both within its current metro area and across the entire U.S. without dedicating more than 30% of its income to rent. We compare only the same type of apartments so that for a household currently living in a studio or one-bedroom we look only at other studios or one-bedrooms; for those living in a two-bedroom we consider only other two-bedrooms; and so on.
For example, Figure 1 below outlines a hypothetical Seattle apartment household that spends 32% of its income on rent. However, based on income, this household could only afford to pay $141 per month in rent without becoming cost burdened. Yet only 0.2% of the 2-bedroom apartments in the Seattle area have rents affordable to them. But they wouldn’t fare much better by moving to a less expensive area. At that income level, this household could still only afford to live in 0.4% of the two-bedroom apartments across the U.S. and would likely still be burdened if it moved to a more inexpensive metro area.
Low-earner apartment households tend to have particularly severe housing cost burdens. In fact, 90% of low-earner apartment households were severely cost-burdened in 2020, compared to 27% of all apartment households and 53% of all cost-burdened households. This indicates deep subsidy is needed to enable them to locate an affordable unit. Metro areas with the highest shares of severely cost-burdened low-earner apartment households include Dallas-Fort Worth (97%), Las Vegas (97%), and Tampa (96%).
Geographically-Burdened Renters Are Stretched by Local Market Conditions
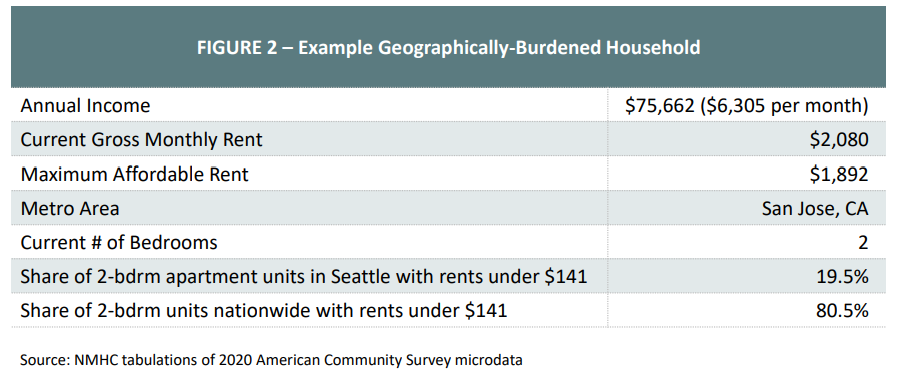
We define geographically-burdened households as those that can afford a much higher share [1] of total U.S. apartments than what they can afford in their local markets.
Figure 2 below shows a hypothetical San Jose apartment household that could only afford 19.5% of two-bedroom units within the metro area in 2020 without being considered cost-burdened ($1,892 per month rent). However, that same household would be able to afford 85.5% of all two-bedroom apartments nationwide with its $75,000+ annual income. In other words, this household likely would no longer be considered burdened if (1) San Jose housing costs dropped significantly closer to the national average or (2) they moved to a metro area with lower housing costs.
Geographically-burdened households made up less than 8% of all U.S. apartment households in 2020, but this share was much higher in some of the nation’s pricier markets. For instance, 27% of apartment households in San Diego fell into this category, while 26% did in San Jose and 25% in Los Angeles.
[1] We specifically look at apartment households with a share increase of at least 15 percentage points; for instance, if an apartment household can afford 10% of apartment units in its metro and 25% of apartment units nationwide.
High-Earner Renters Have Options for More Affordable Housing
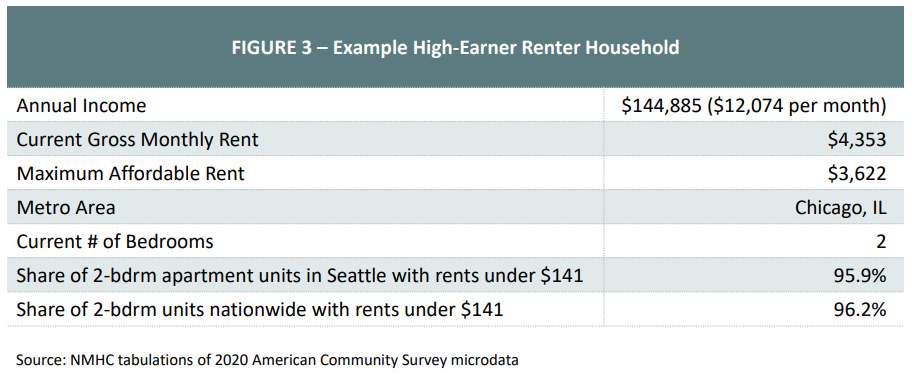
We describe high earners as those apartment households that spend more than 30% of their income on rent—making them cost-burdened—despite being able to afford at least 80% of the apartment units in their metro areas.
The apartment household featured in Figure 3, for instance, could afford nearly all (96%) of the two-bedroom apartments in Chicago in 2020 without paying more than 30% of its income on rent ($3,622 per month rent).
We assume then that this household chose to live in a slightly more expensive apartment, perhaps due to its size, location, or other luxury features and amenities. Additional financial assistance is likely unnecessary for these high-earning households, although they technically are included in the overall calculation of cost-burdened apartment households.
Couples without children made up more than a quarter (27%) of high-earning apartment households, compared to just 19% of all apartment households and 12% of all burdened apartment households. Many of these households benefited from being dual income. High-earning apartment households recorded a median income of $83,309 in 2020, more than double the median income of all apartment households ($40,246) and triple the median income of all cost-burdened apartment households ($23,141).
These Nuances Matter When Implementing Policy
This drill-down shows that simply applying the 30% cost-burden rule oversimplifies rental affordability challenges, removing important nuances to determining how best to help cost-burdened renter households.
Our Key Takeaways:
- Additional supply will prove inadequate in helping lower-earner apartment households, as they will likely be unable to afford market-rate housing without some form of financial assistance or government subsidy.
- Building more apartments in more expensive, supply-constrained markets can help ease housing cost burdens among those geographically-burdened renters struggling in high-price markets.
- Shifting employment trends, including the rise of remote work for a portion of the nation’s economy, could allow many of those that were geographically burdened to relocate to lower-cost areas.
- A small share of apartment households that spend more than 30% of their income on rent are actually well off and simply choose to live in more expensive housing.
What’s Next: NMHC and NAA will release updated demand research in July 2022. Understanding the financial situation of apartment households in each state and metro area will help policymakers and developers understand what types of apartments (and at what price points) are needed the most and can tailor solutions to that jurisdiction.
About Research Notes: Published quarterly, Research Notes offers exclusive, in-depth analysis from NMHC’s research team on topics of special interest to apartment industry professionals, from the demographics behind apartment demand to effect of changing economic conditions on the multifamily industry.